Cross-Sport Fatigue Tracking: Recovery Metrics in Tennis and Basketball Betting Strategies
Written by Mia Lehmann · Jun 11, 2026
Cross-Sport Fatigue Tracking: Recovery Metrics in Tennis and Basketball Betting Strategies
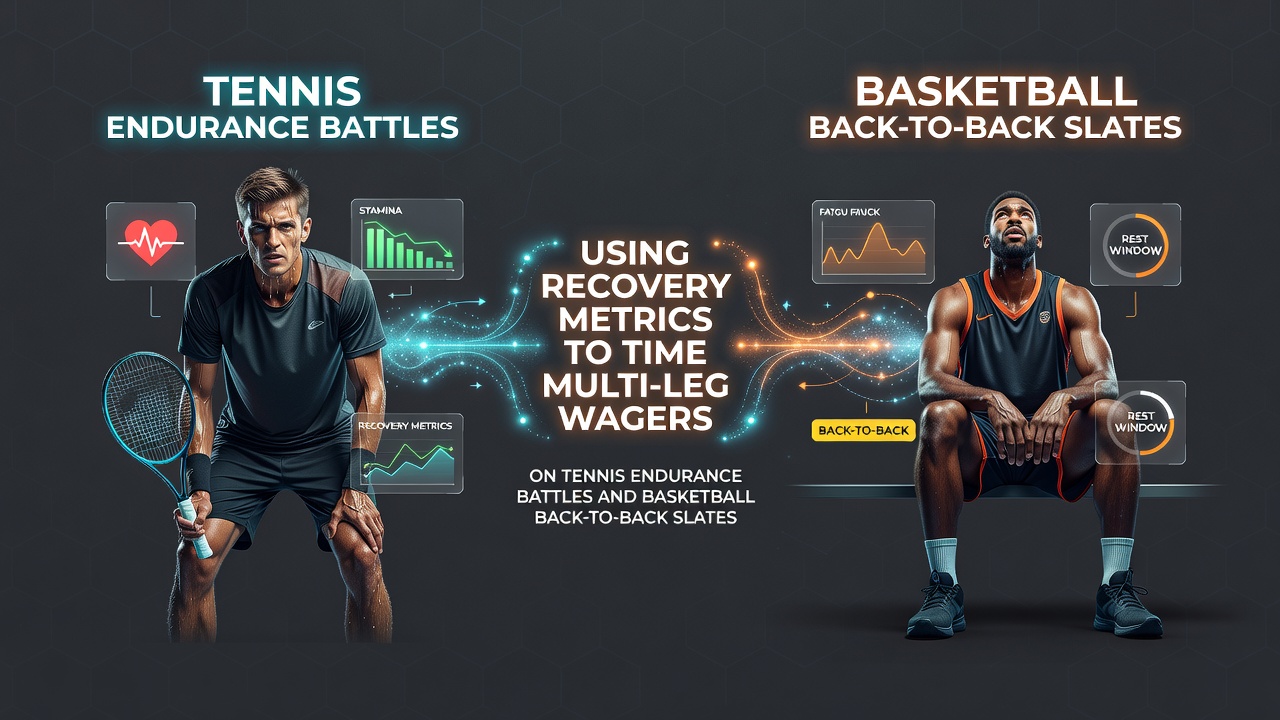
Cross-sport fatigue tracking combines recovery data from tennis endurance matches with basketball back-to-back schedules, and this approach helps structure multi-leg wagers around player performance patterns. Observers note that metrics such as heart rate variability, sleep duration, and muscle soreness indicators provide measurable inputs for timing bets across these two sports, especially when schedules overlap in June 2026.
Understanding Fatigue in Tennis Endurance Battles
Tennis matches that extend beyond three sets often produce cumulative physical stress, and data from professional tournaments shows elevated cortisol levels along with reduced serve accuracy after the fourth set. Researchers at the Australian Institute of Sport have documented how players who play consecutive long matches experience measurable declines in movement efficiency, which correlates with changes in rally win percentages. Those who study match logs find that athletes with lower recovery scores from prior rounds tend to drop first-serve percentages by 8 to 12 percent in later rounds, creating observable patterns that influence accumulator structures.
Basketball Back-to-Back Slate Patterns
Basketball teams facing consecutive games within 24 hours show distinct performance dips, particularly in defensive efficiency and three-point shooting volume. League tracking systems record average point differentials narrowing by 4 to 6 points on the second night of back-to-backs, while player tracking cameras capture reduced sprint distances and jump heights. Figures from the 2025-2026 NBA season indicate that teams with shorter rest intervals post-travel maintain lower offensive rebound rates, and these statistics align with recovery data collected through wearable devices.
Key Recovery Metrics and Their Measurement
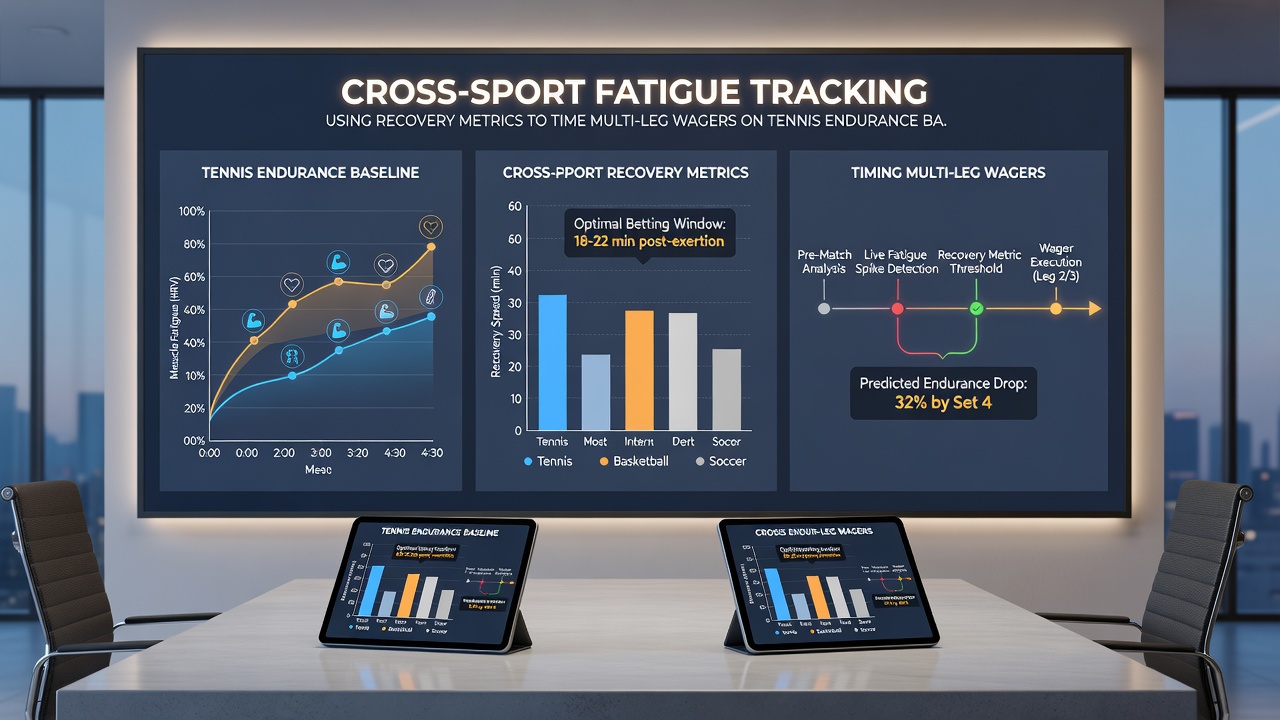
Heart rate variability remains one of the most cited indicators because it reflects autonomic nervous system balance, and lower scores often precede reduced explosiveness in both tennis serves and basketball drives. Sleep trackers record total sleep time and sleep efficiency, while subjective soreness scales completed by training staff add qualitative layers that quantitative sensors sometimes miss. Studies published in the Journal of Sports Sciences demonstrate that combining these three data streams improves prediction accuracy for next-day performance decrements compared with single-metric approaches.
Applying Metrics to Multi-Leg Wager Timing
Multi-leg wagers gain structure when bettors align tennis endurance legs with basketball back-to-back legs using synchronized recovery thresholds. A player whose heart rate variability drops below baseline for two consecutive days may enter a match with elevated fatigue risk, and similar thresholds apply to basketball rotations that average under six hours of rest. Data aggregation platforms now feed live recovery scores into models that flag statistical edges, allowing wager timing to shift toward underdog outcomes or total point adjustments when fatigue indicators rise. Those who track both sports simultaneously report that overlapping tournament windows in June 2026 create more frequent opportunities to layer such data points.
Case Examples from Recent Seasons
One documented instance involved a tennis player who competed in a five-set quarterfinal followed by a four-set semifinal within 48 hours; recovery metrics showed persistent elevation in muscle soreness scores, and the subsequent match statistics reflected a 15 percent drop in winners hit. In basketball, a team completing a cross-country flight before a back-to-back produced lower effective field goal percentages on the second night, matching pre-game heart rate variability readings collected from key rotation players. These examples illustrate how separate sports generate parallel fatigue signatures that can be monitored together.
Integration Challenges and Available Tools
Cross-sport data integration requires standardized formats because tennis governing bodies and basketball leagues collect slightly different variables. Platforms that normalize heart rate variability and sleep metrics across devices now allow side-by-side comparison, and several research institutions have released open datasets covering both sports. Observers note that June 2026 schedules include overlapping grass-court tennis events and NBA playoff-adjacent basketball slates, increasing the volume of recoverable data points for analysis.
Conclusion
Recovery metrics drawn from tennis endurance battles and basketball back-to-back slates supply factual inputs that inform multi-leg wager timing. Data from heart rate variability, sleep tracking, and soreness indicators continues to expand across both sports, and structured use of these measurements supports systematic approaches to accumulator construction without reliance on subjective judgment.